Ticket report
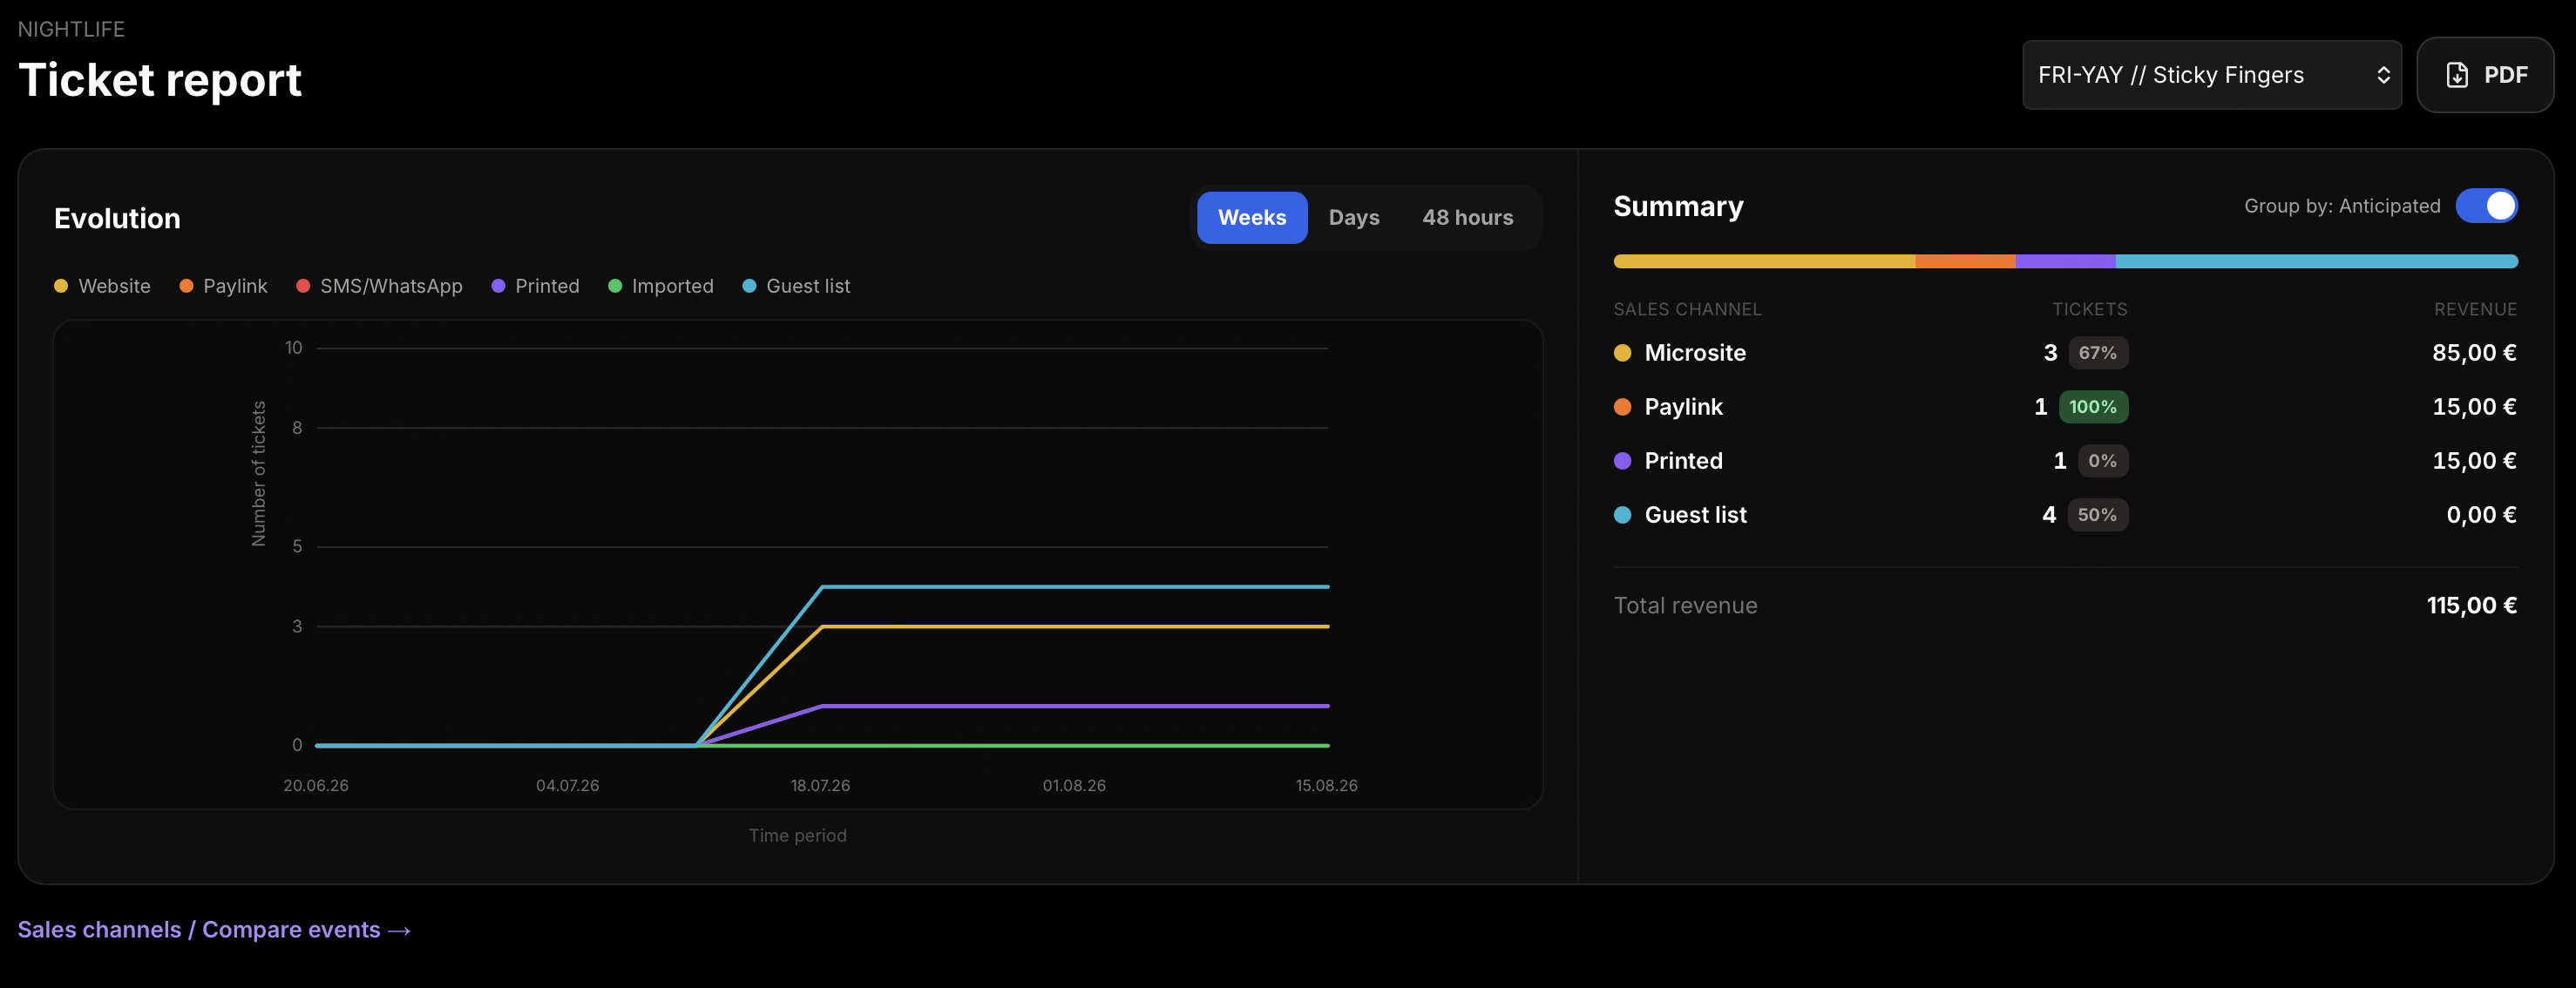
Select an event to view ticket trends by week, day, or the last 48 hours. Review tickets sold and revenue by sales channel, optionally group by Anticipated, then export a PDF report.
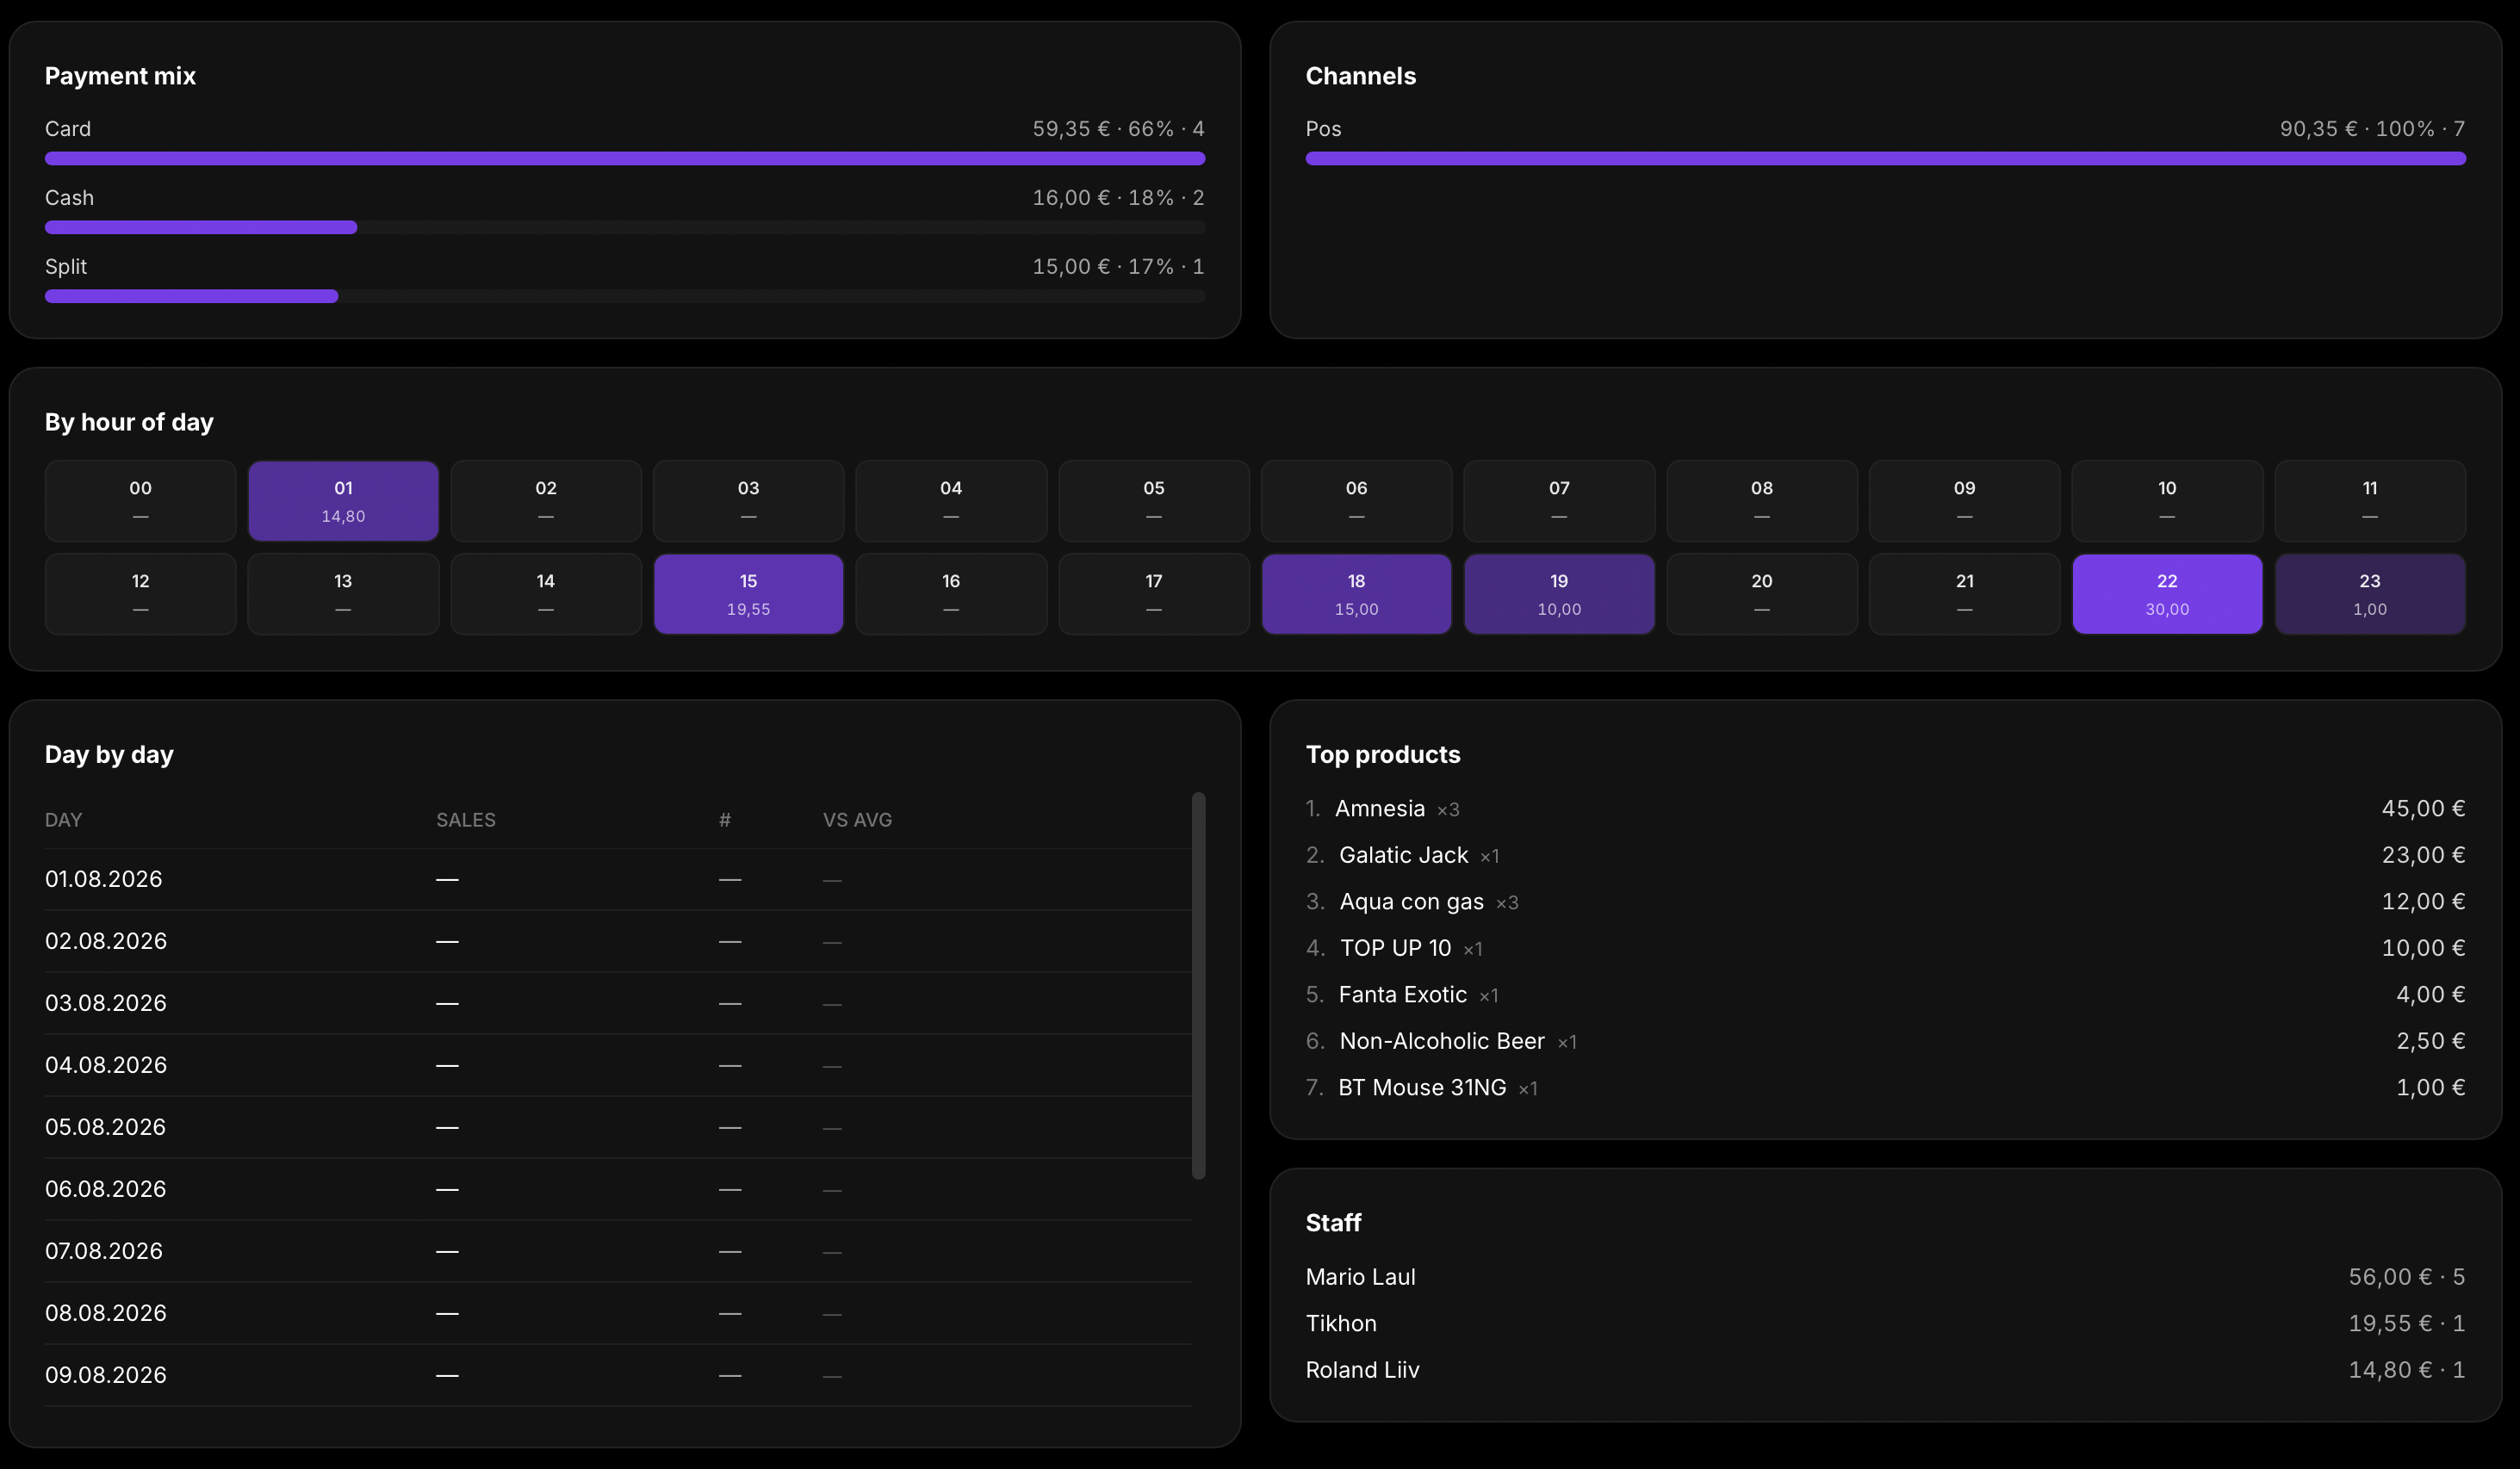
Three Manager screens for venue analytics. Ticket Report shows sales evolution by week, day, or the last 48 hours, with channel summaries and PDF export. Compare places two events side by side for sales, revenue, inventory, and attendance. Daily Logs cover POS and Kitchen activity, Cash close Z-reports, and a Sales report with KPIs, payment mix, hourly performance, top products, and staff results.

Explore Hubumo’s reporting tools for ticket sales, event performance, POS activity, cash sessions, and venue operations.
Select an event to view ticket trends by week, day, or the last 48 hours. Review tickets sold and revenue by sales channel, optionally group by Anticipated, then export a PDF report.
Select two events to compare total sales, revenue, inventory, registrations, and attendance side by side. Review daily ticket sales, cumulative revenue, revenue by category, and attendance by ticket type, then export the comparison as a PDF.
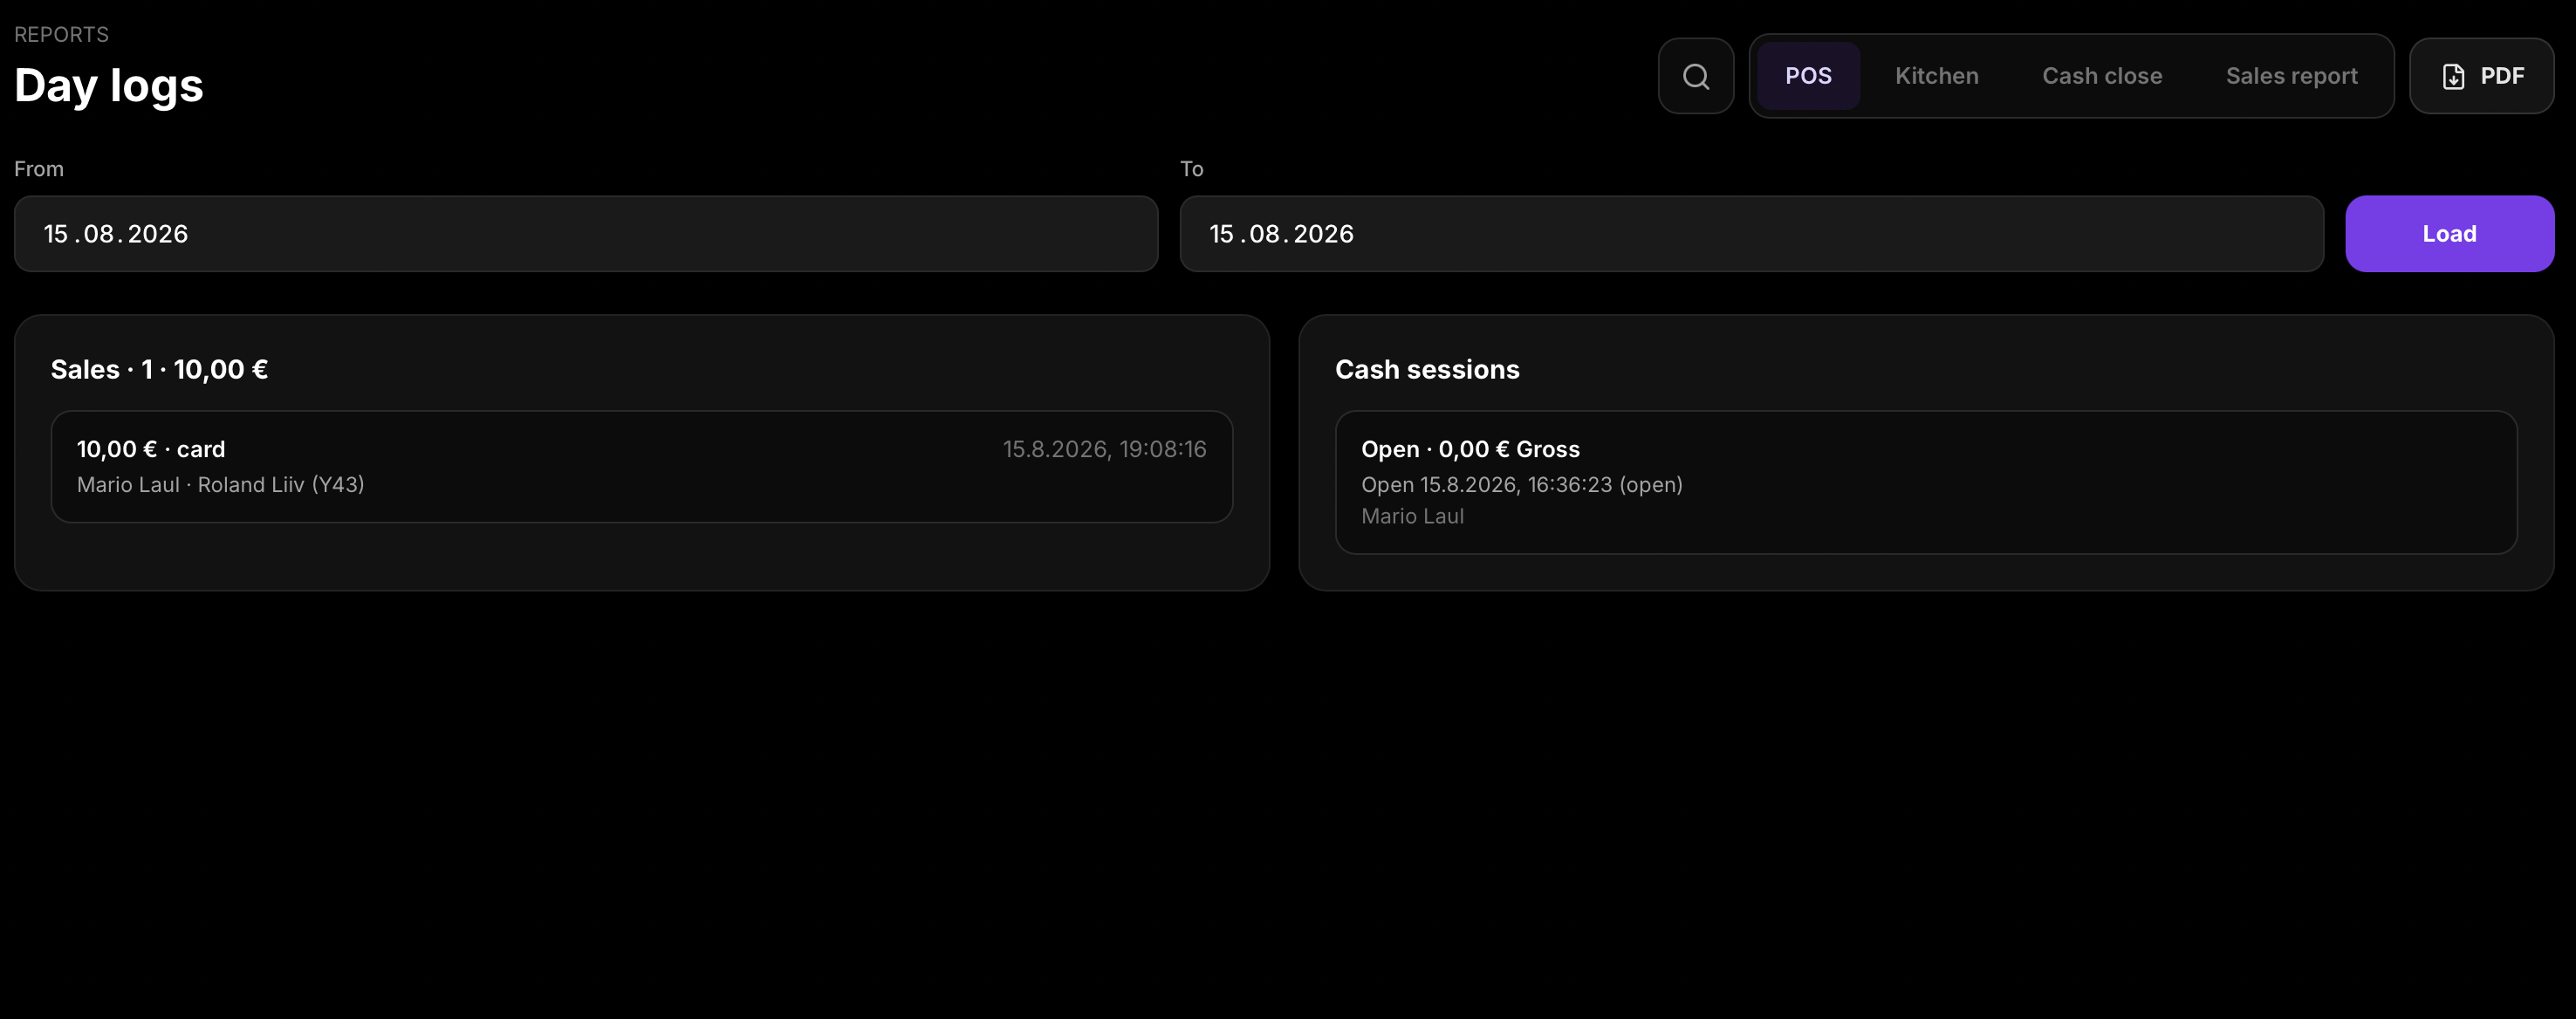
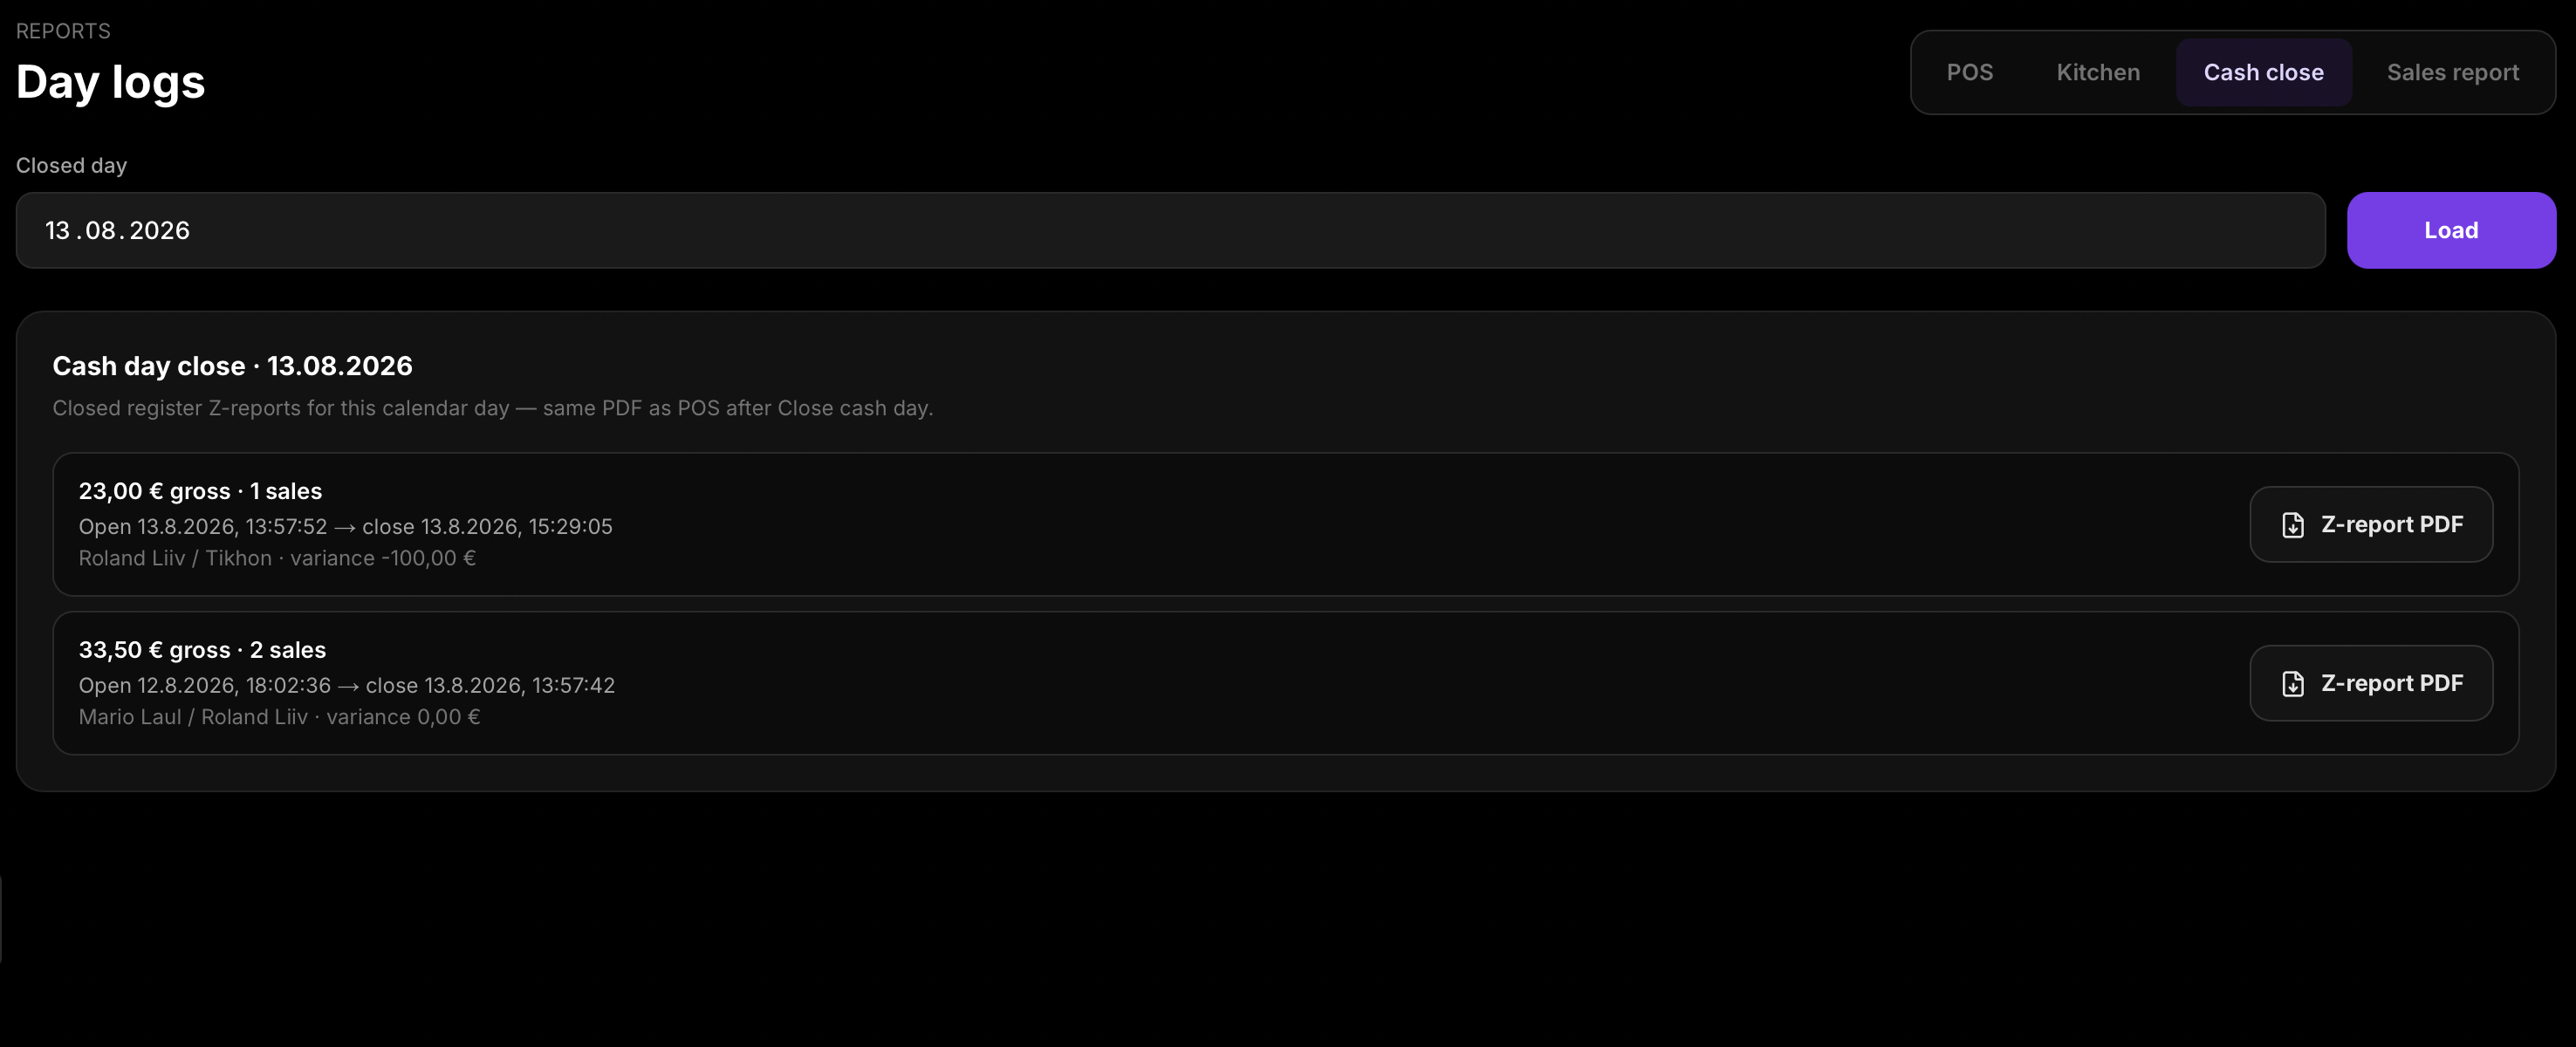
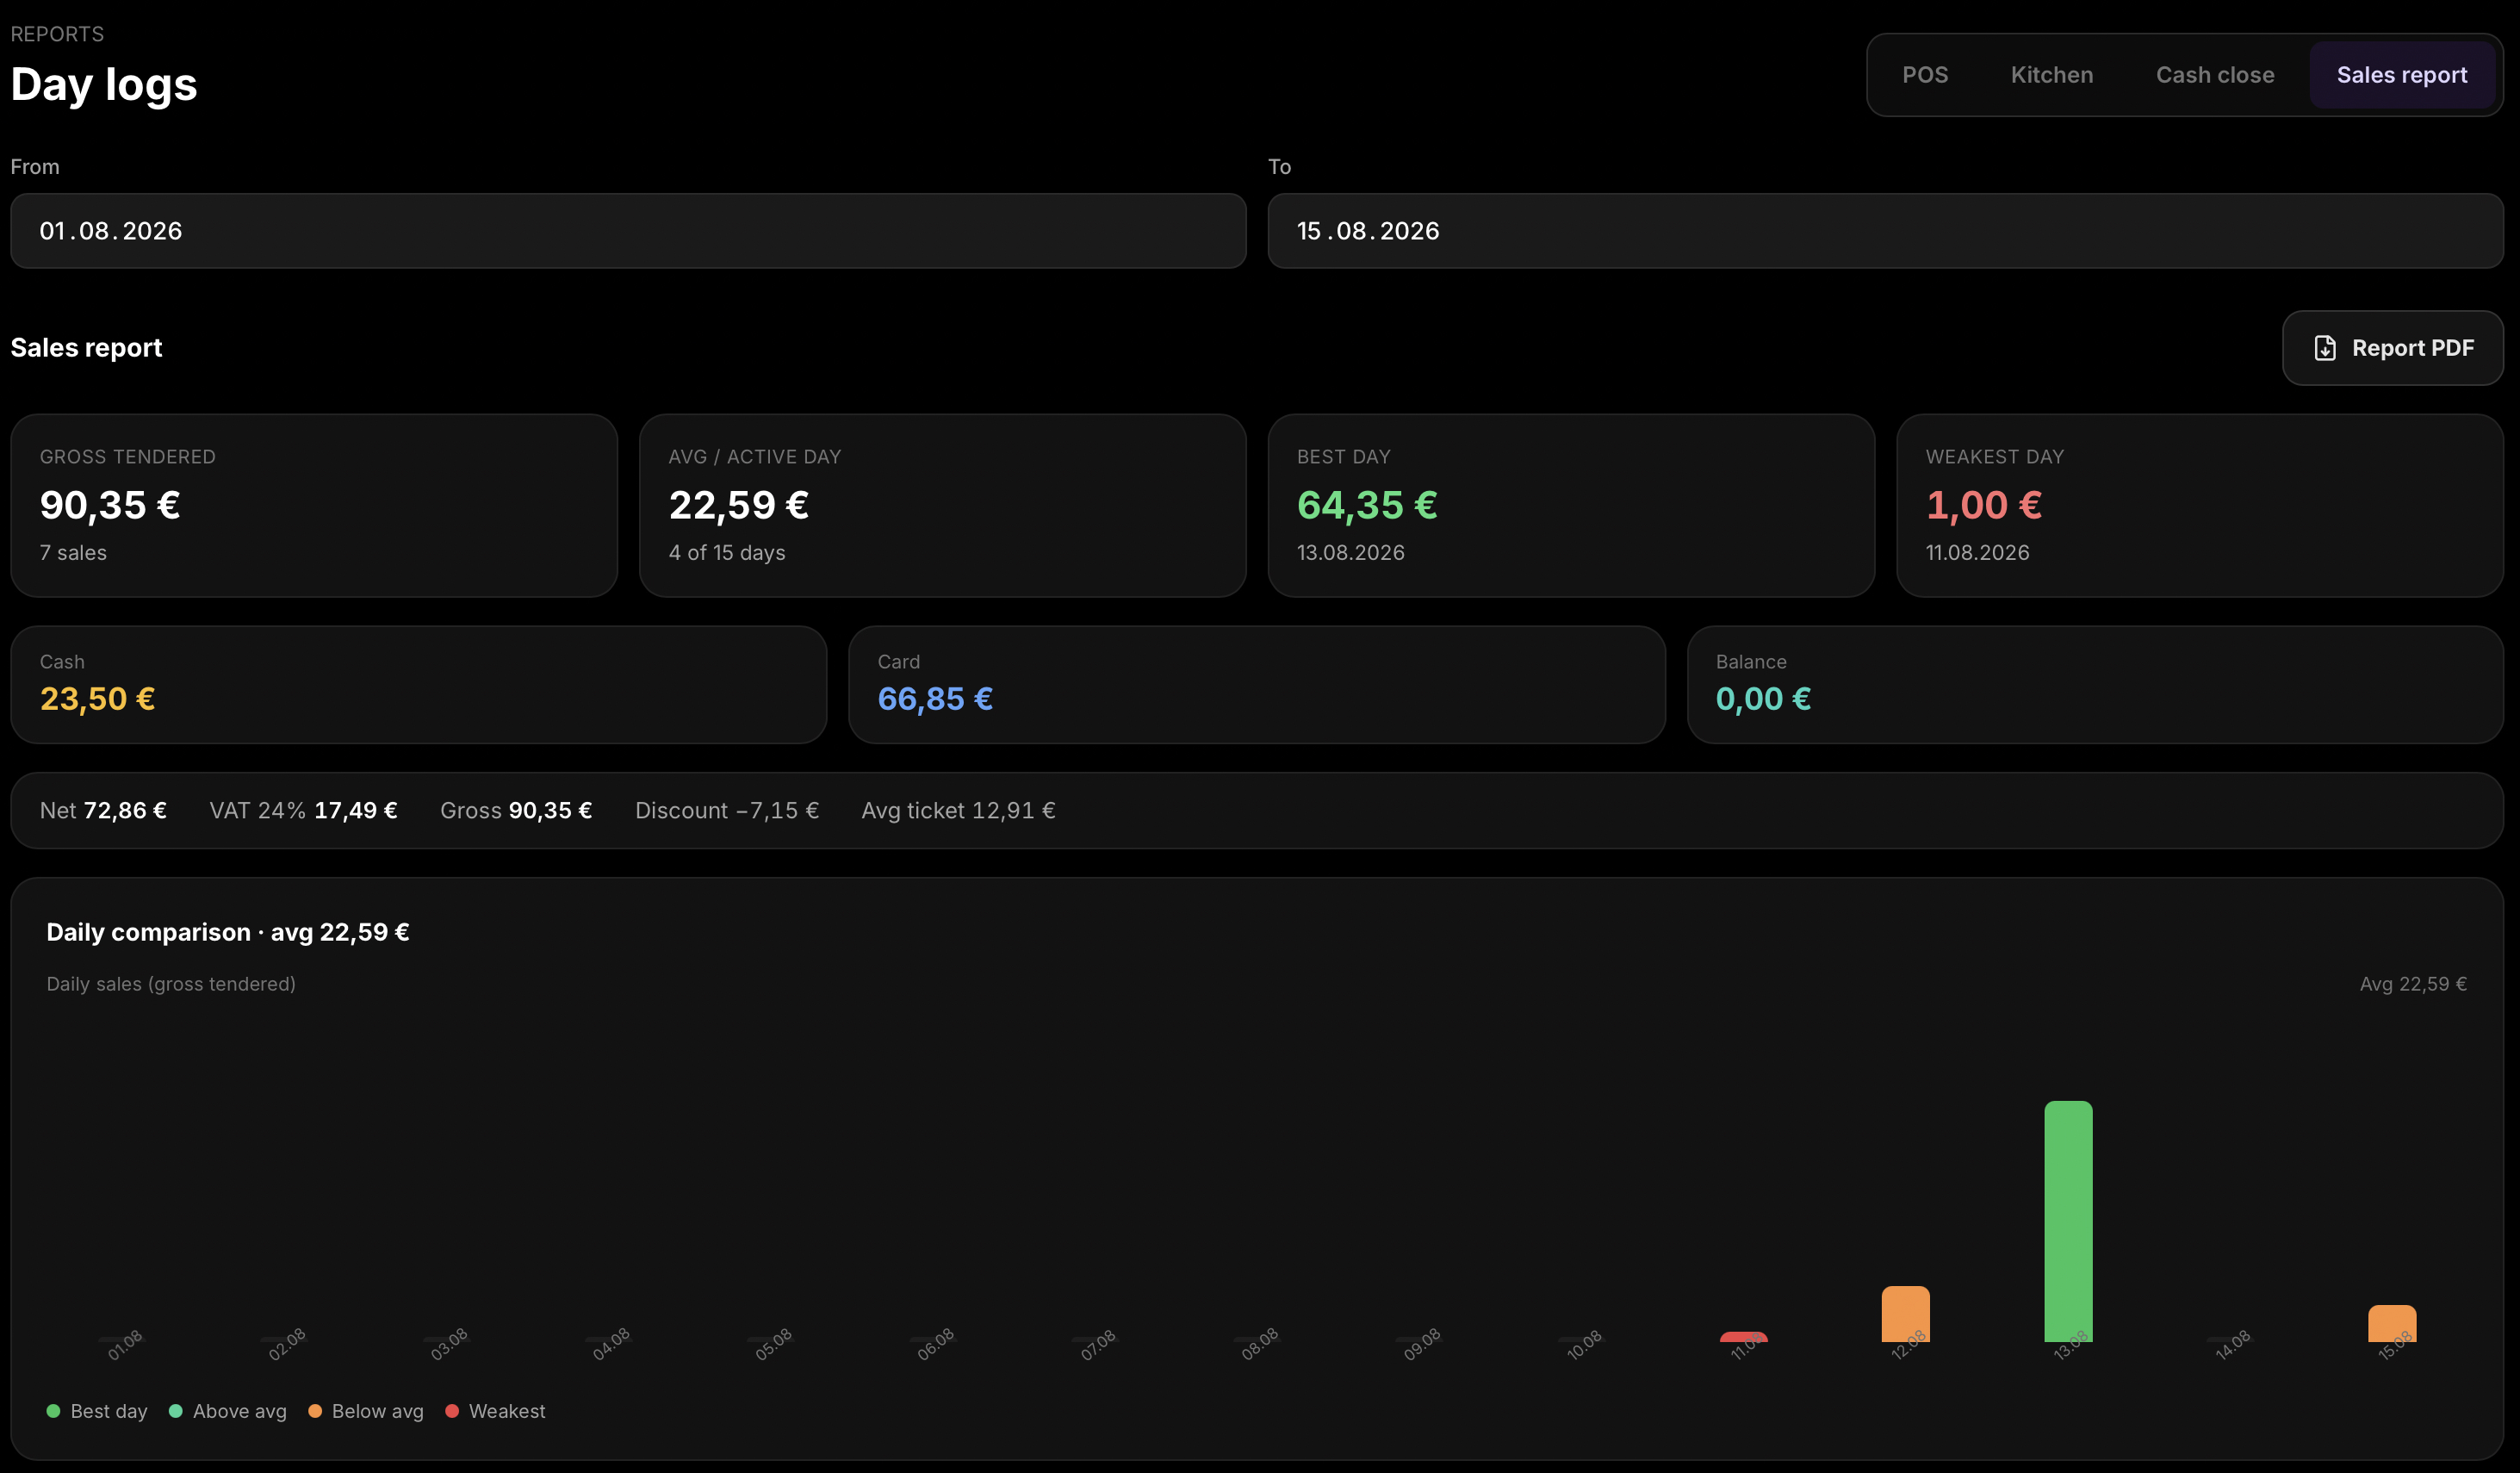
POS and Kitchen reports show activity for a selected date range. Cash close provides closed-register Z-reports for a calendar day. The Sales report aggregates every completed sale with gross totals, payment mix, hourly and daily performance, top products, and staff results — then export as a PDF.
In Manager, open Ticket Report, select an event, and export the results as a PDF.
Open Compare, select two events, and export the comparison as a PDF.
Open Daily Logs, choose POS, Cash close, or Sales report, select the date range or day, load the results, and export a PDF.
Real Hubumo screens from this module — each image shows a distinct workflow, not a repeated shot.

Tell us about your venue, your locations, and what you want to improve. A member of the Hubumo team will contact you shortly.